Market Type: Urban / Walk-In · Low Baseline
| GBP Actions | |||
| Direction Requests | +113% | Total Actions | +34.7% |
| Top-3 Map Pack Visibility | |||
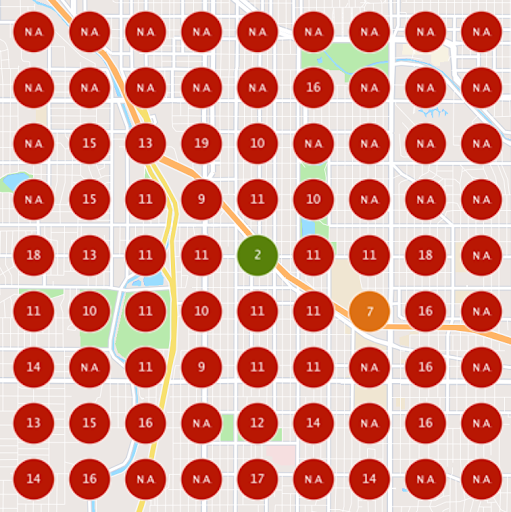
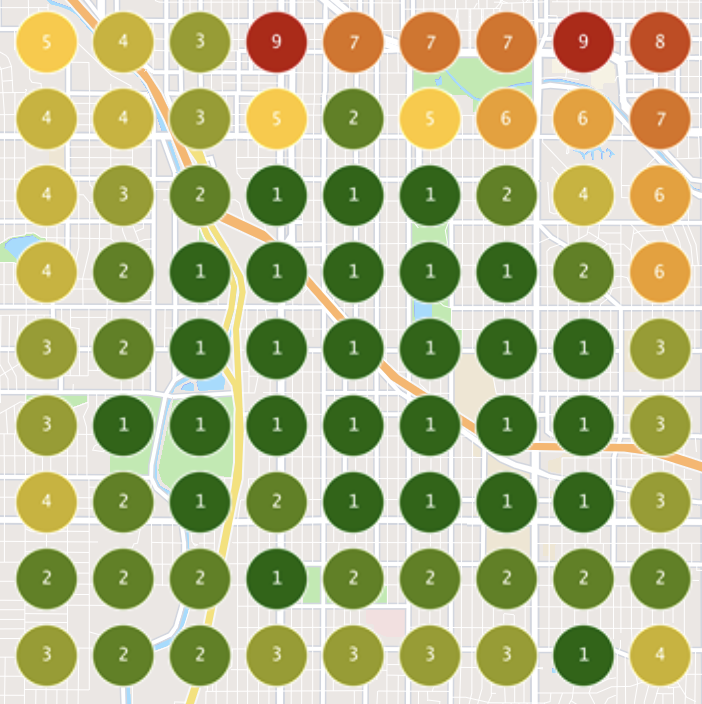
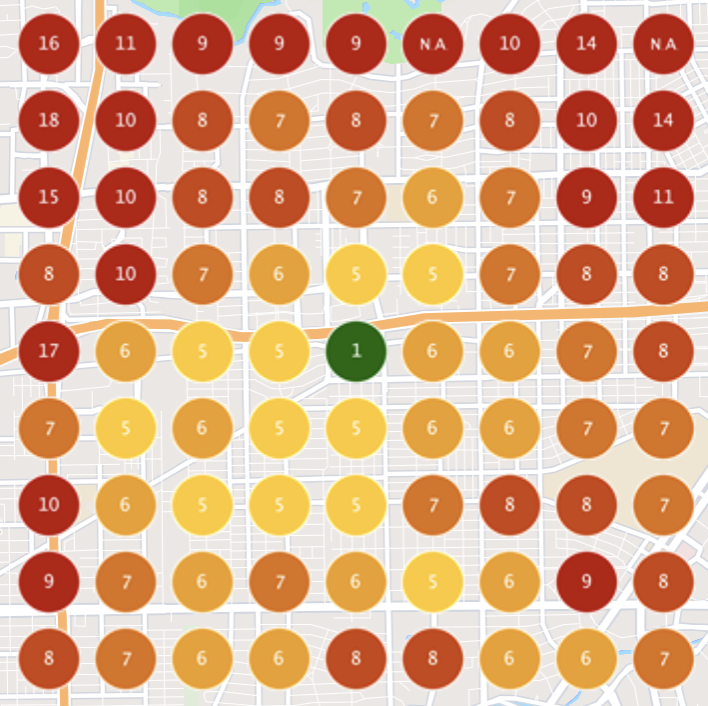
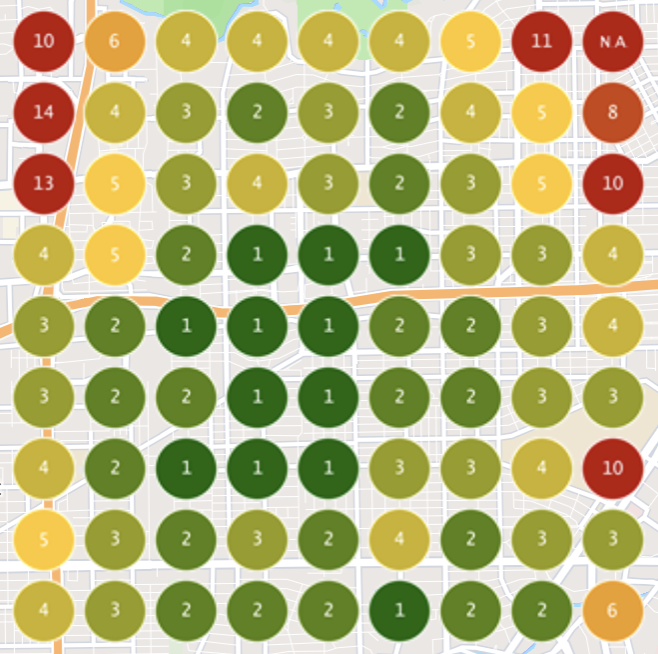
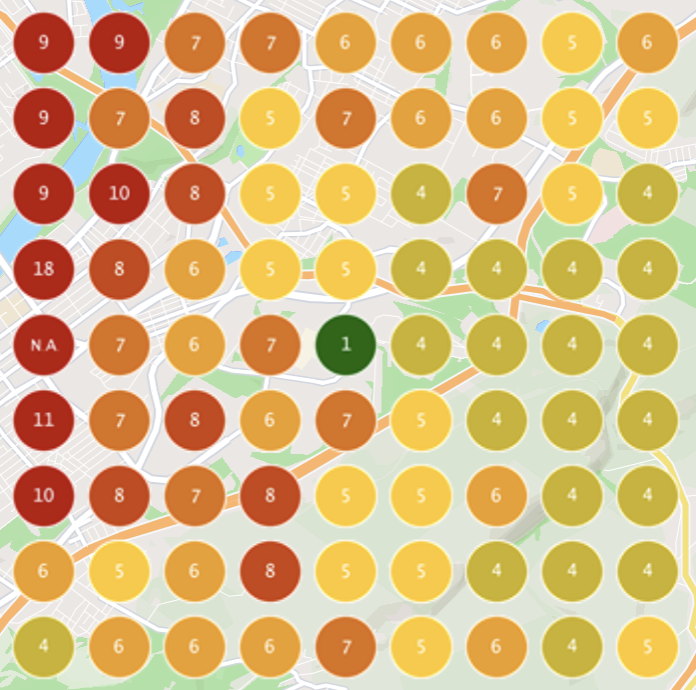
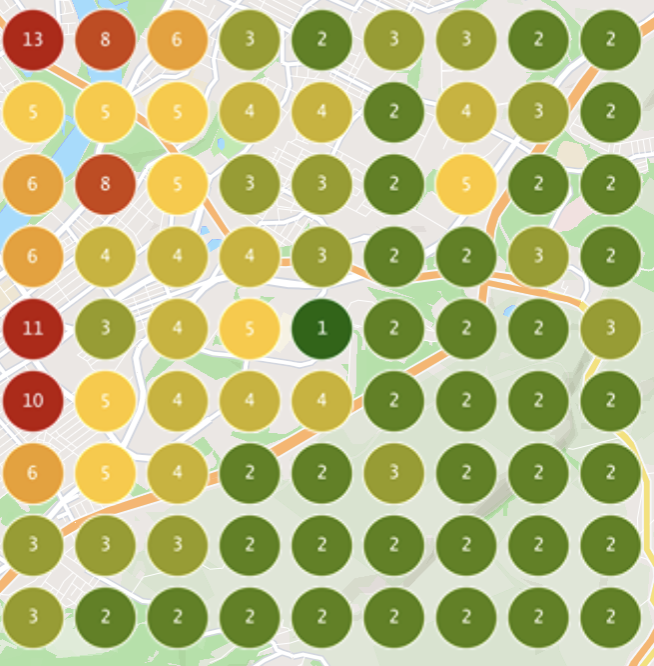
| Juice Shop Denver | 1.23% → 72.84% | Coverage | 90% → 100% |
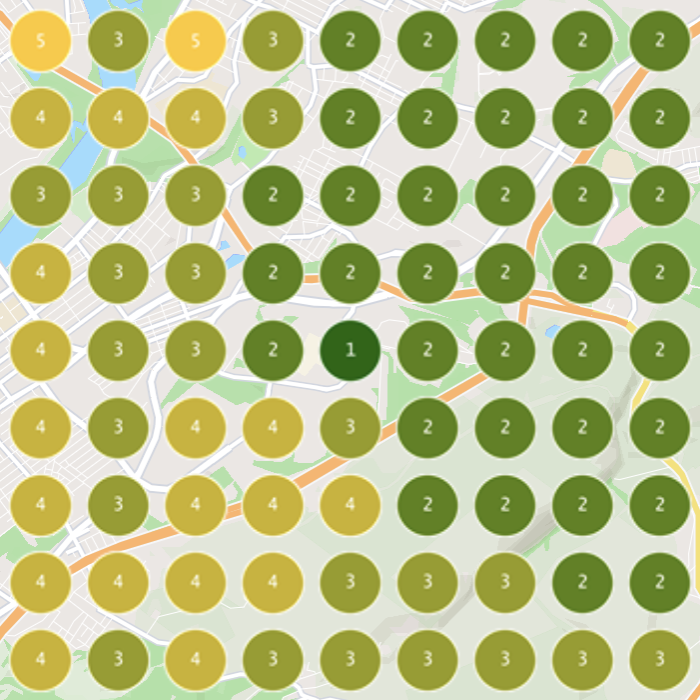
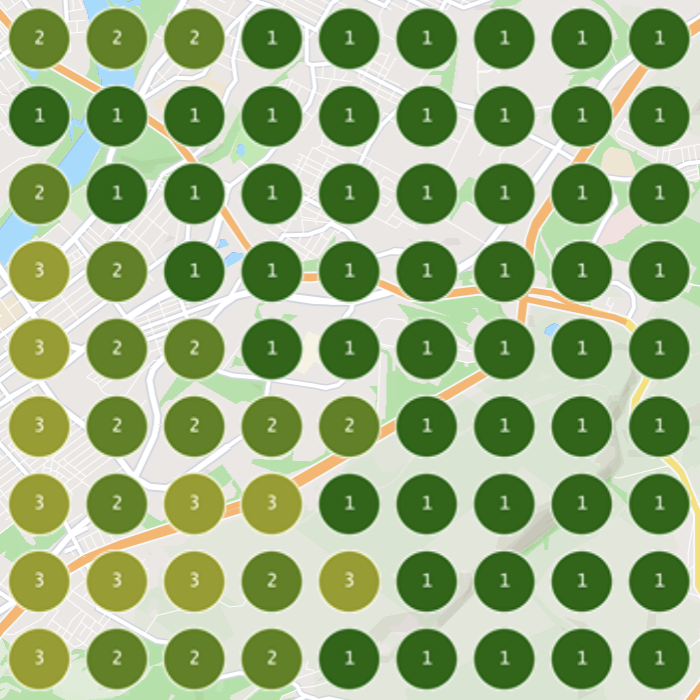
| Smoothie Bar Near Me | 7.41% → 48.15% | Coverage | 96% → 97% |
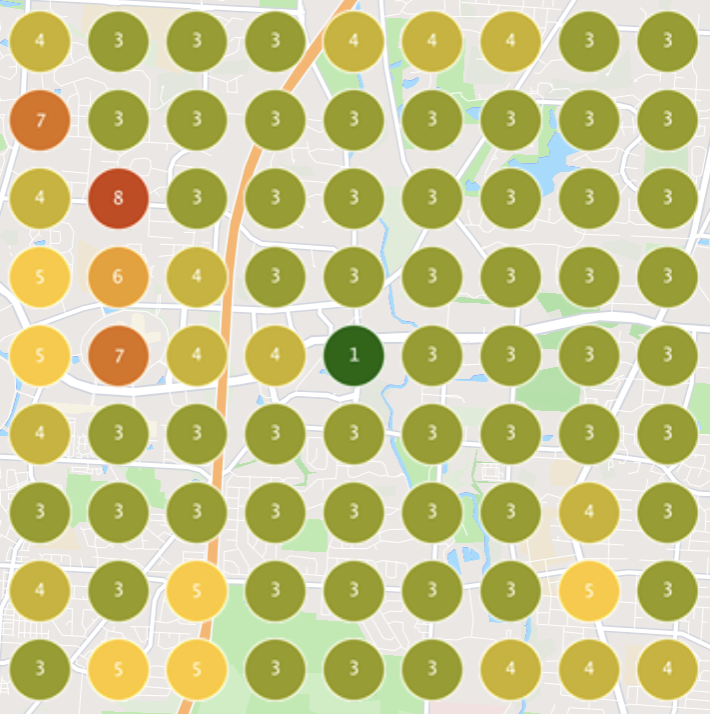
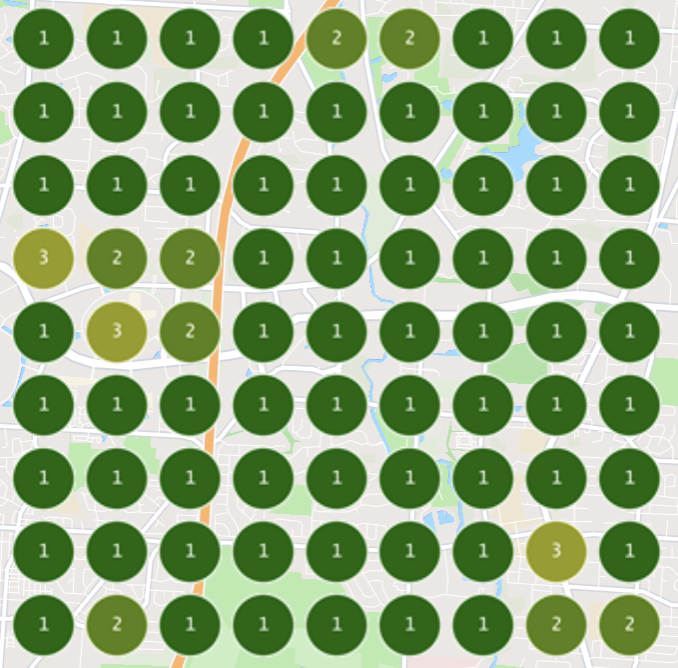
Juice Shop Denver
BEFORE — Grid Scan
AFTER — Grid Scan
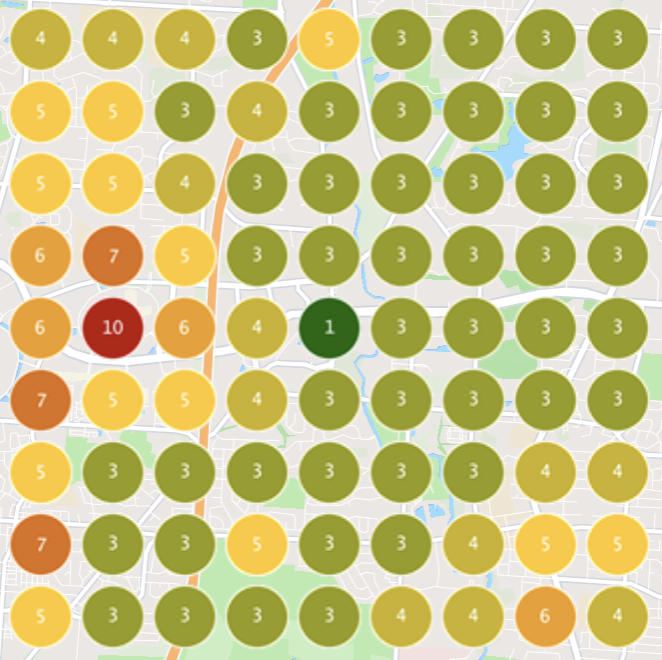
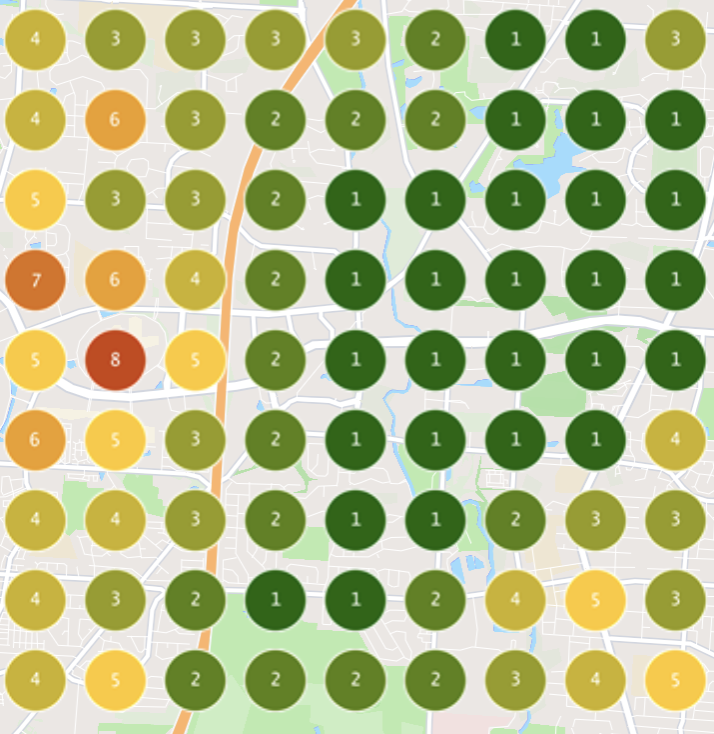
Smoothie Bar Near Me
BEFORE — Grid Scan
AFTER — Grid Scan
Rapid breakout. Rankings translated directly into navigation behavior.
Market Type: Urban / Competitive · Campus (Houston)
| GBP Actions | |||
| Direction Requests | +127% | Total Actions | +62.2% |
| Top-3 Map Pack Visibility | |||
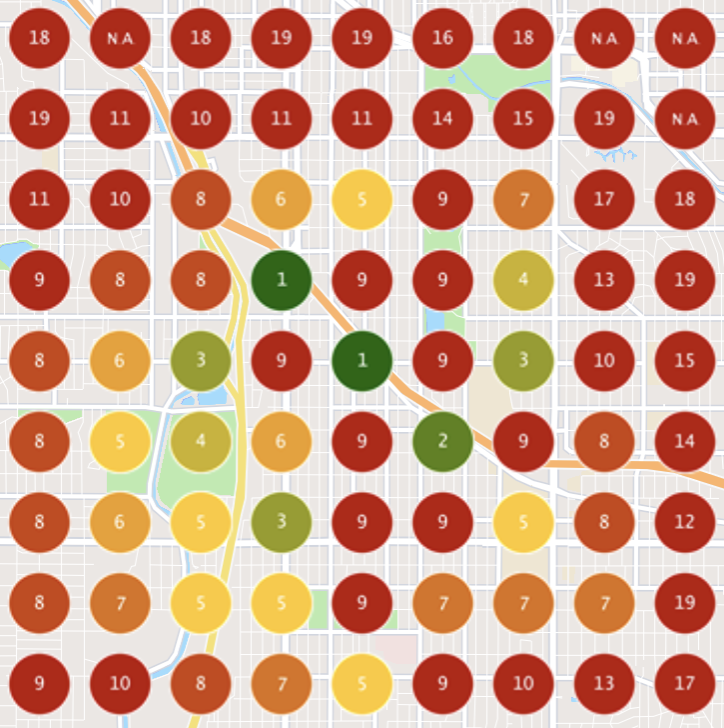
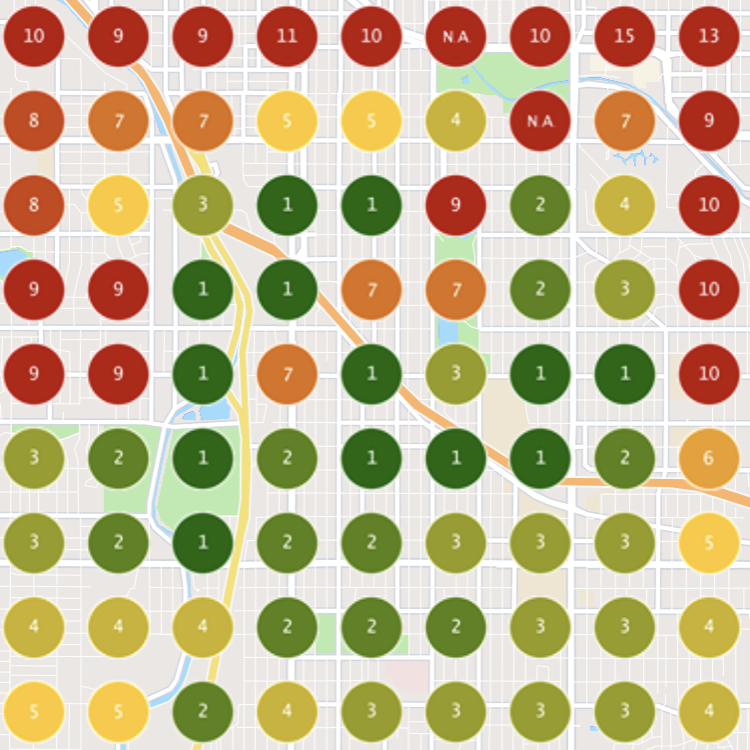
| Smoothies Near Me | 1.23% → 62.96% | Coverage | 98% → 100% |
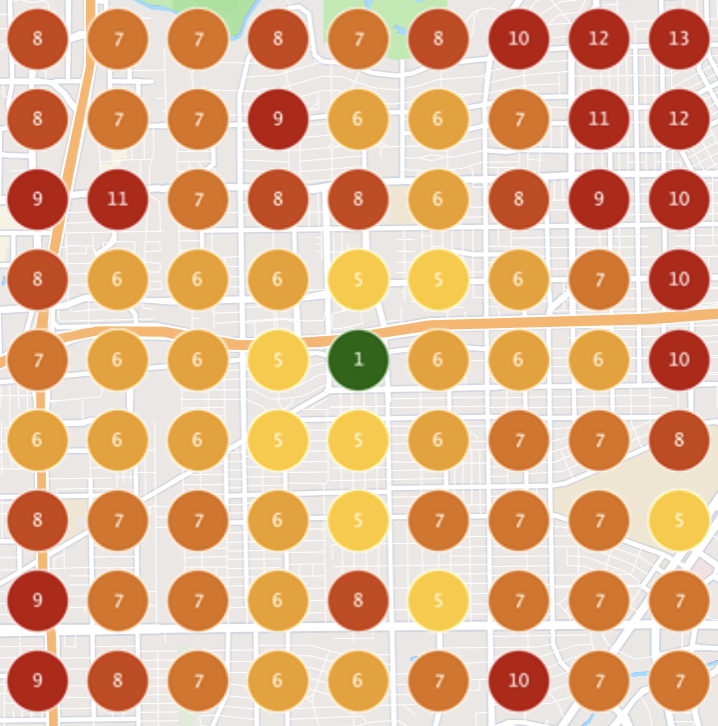
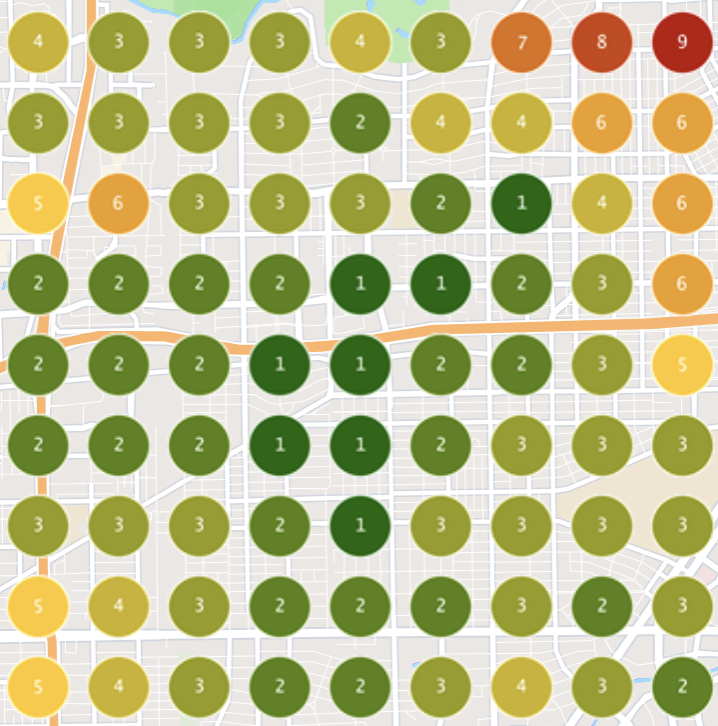
| Juice Shop Houston | 1.23% → 75.31% | Coverage | 100% → 100% |
Smoothies Near Me
BEFORE — Grid Scan
AFTER — Grid Scan
Juice Shop Houston
BEFORE — Grid Scan
AFTER — Grid Scan
Competitive urban markets unlock quickly. Significant non-brand demand captured.
Market Type: Suburban / High Baseline
| GBP Actions | |||
| Direction Requests | +66% | Total Actions | +21.6% |
| Top-3 Map Pack Visibility | |||
| Juice Shop Near Me | 70.37% → 100% | Coverage | 100% → 100% |
| Smoothie Shop Near Me | 58.02% → 72.84% | Coverage | 100% → 100% |
Juice Shop Near Me
BEFORE — Grid Scan
AFTER — Grid Scan
Smoothie Shop Near Me
BEFORE — Grid Scan
AFTER — Grid Scan
Strong locations still have upside. Action growth outpaced impressions.
Market Type: Small Market / Car-Dependent
| GBP Actions | |||
| Direction Requests | +45% | Total Actions | +22.9% |
| Top-3 Map Pack Visibility | |||
| Healthy Food Near Me | 1.23% → 65.43% | Coverage | 100% → 100% |
| Smoothie Place Near Me | 75.31% → 100% | Coverage | 100% → 100% |
Healthy Food Near Me
BEFORE — Grid Scan
AFTER — Grid Scan
Smoothie Place Near Me
BEFORE — Grid Scan
AFTER — Grid Scan
Even with declining impressions, improved relevance drove more high-intent behavior.